How Step 7 Replaced a Manual Reporting Operation with Microsoft Power BI and a SQL Server Data Warehouse — Delivering On-Demand KPI Dashboards Accessible from Any Device
A Seattle-area knife and tactical gear manufacturer with products distributed to customers in over 60 countries had a reporting problem hiding in plain sight. With thousands of SKUs sold through a network of specialty and large chain retail partners to military professionals, law enforcement, hunters, and outdoor enthusiasts, the business had outgrown its reporting infrastructure. Every report was produced manually in Excel — large files, slow to produce, impossible to share on mobile, and offering no way for management to interact with the data in real time.
Outcome: A fully implemented Microsoft Power BI platform fed by a centralized SQL Server data warehouse — delivering over a dozen interactive reports and a KPI dashboard accessible on demand from any browser, tablet, or mobile device, with staff trained to build and distribute new reports independently.
Client Background
The client is a Seattle-area knife and tactical gear manufacturer with approximately 70 employees, a product catalog spanning thousands of SKUs, and distribution across 60+ countries. Their customer base includes military and law enforcement professionals, hunters, outdoor enthusiasts, and industrial tradespeople — served through a broad network of specialty and large chain retail partners.
At that scale, timely access to performance data is a competitive requirement. But all of it was being delivered through manually built Excel spreadsheets — time-consuming to produce, difficult to distribute, and offering no interactivity once delivered. Step 7 Consulting was engaged to assess the reporting landscape, recommend a platform, and lead the full implementation from data architecture through staff training.
Challenges
- All business reporting produced manually in Excel — slow, labor-intensive, and dependent on individual staff
- Large file sizes making reports difficult to share and inaccessible on mobile
- No interactivity — every new question required rebuilding a spreadsheet
- No centralized data source — reports assembled from disconnected inputs, creating consistency risk
- Transactional data in Microsoft Dynamics requiring structured extraction and transformation before it could support reporting
- Reports needed to be accessible on demand from any device, without IT involvement
Solution
Step 7 led the engagement from technology assessment through production deployment — conducting stakeholder discovery, recommending Microsoft Power BI, designing and building a SQL Server data warehouse, creating over a dozen reports and a KPI dashboard, and training staff to build and distribute new reports independently.
Technology Assessment & Platform Recommendation
Before recommending a platform, Step 7 conducted a structured assessment — bringing together key stakeholders to understand how reports were created, what data sources were involved, how they were distributed, and what management actually needed. Platforms were evaluated against ease of use, integration capability with Microsoft Dynamics, mobile accessibility, scalability, and total cost of ownership.
The recommendation to use Microsoft Power BI was presented to leadership with detailed rationale covering every stated requirement. This assessment phase gave leadership confidence in the investment before build began and prevented a costly platform decision made on assumptions.
Data Warehouse Design & Integration
The foundation of the reporting solution is the data warehouse — a centralized repository designed specifically for reporting and analysis. Unlike an operational database optimized for recording transactions, a data warehouse is structured to make it fast and flexible to query large volumes of historical data. Without it, every Power BI report would query the operational system directly, creating performance risk and data consistency problems.
Step 7 designed and built a Microsoft SQL Server data warehouse that aggregates transactional data from Microsoft Dynamics on a scheduled basis, consolidating it into a single, consistent reporting layer. The data pipeline uses an ETL process — Extract, Transform, Load — pulling raw transactional data from Microsoft Dynamics, restructuring it into a reporting-ready format, and loading it into SQL Server on a schedule. ETL is the backbone of any data warehouse implementation: without it, the warehouse has no reliable way to stay current as the business generates new data. This pipeline keeps every report current without manual intervention.
Microsoft Power BI Implementation
With the data warehouse in place, Step 7 built the full Power BI reporting layer. Business intelligence, in practical terms, is the ability to turn operational data into decisions. The shift from a static Excel report to an interactive Power BI report is the difference between reading a summary and interrogating the data yourself.
Implementation included:
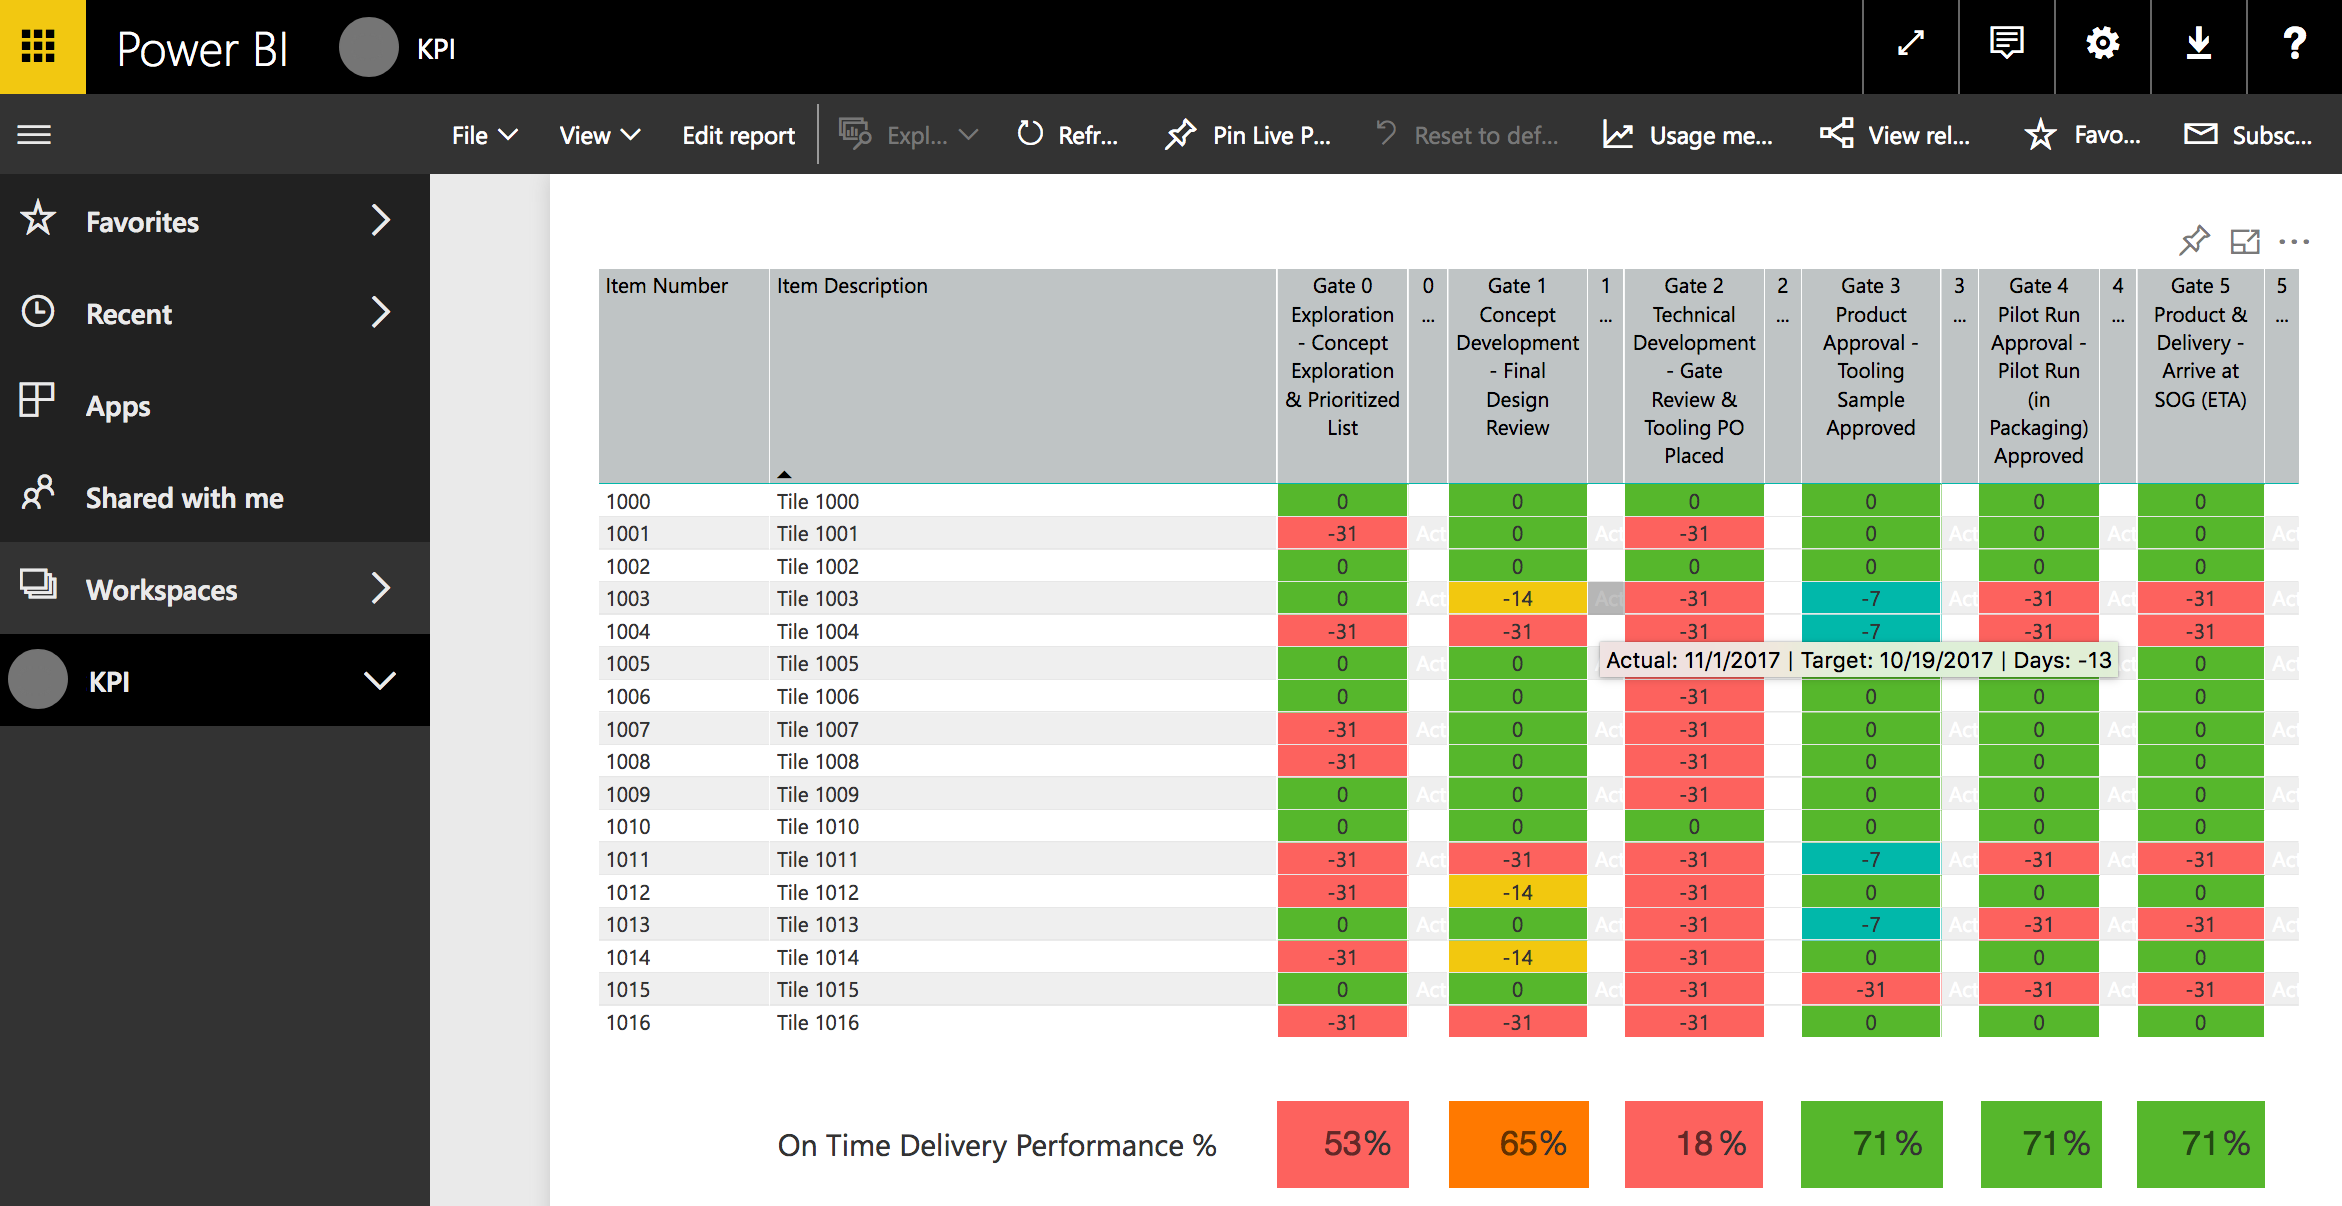
- Over a dozen reports covering business performance across regions, time periods, and product lines
- A KPI dashboard — a single consolidated view of key metrics, updated automatically as new data flows into the warehouse
- Interactive filtering enabling management to slice data by region, time period, and detail level without staff support
- Distribution via Power BI Apps — reports packaged and shared with specific employee groups through a browser or mobile device, with no file attachments or manual distribution
Staff Training & Self-Service Reporting
A BI platform that only specialists can use creates a new dependency rather than solving one. Step 7 trained staff to build reports in Power BI and distribute them as Apps — giving the organization the ability to create and share new reports independently.
Self-service reporting is the goal state for any BI implementation: the people closest to the business questions can answer them directly, without waiting for a developer or analyst. That capability was built into the engagement from the start.
Results
- Eliminated manual Excel-based reporting — reports generated automatically from a live data warehouse
- Over a dozen interactive Power BI reports delivered covering regional, time-period, and product-level performance
- KPI dashboard providing management with on-demand visibility into key metrics
- Reports accessible from any browser, tablet, or mobile device — no file attachments, no distribution overhead
- Management can filter, drill down, and explore data independently
- Staff trained to build and distribute new reports without outside support
- SQL Server data warehouse established as the single source of truth for all business reporting
Why This Matters for Data-Driven Organizations
Many mid-market companies carry more reporting debt than they realize. Excel-based reporting feels manageable until manual effort becomes a bottleneck and the lack of real-time visibility starts costing decisions.
This project demonstrates how Step 7 Consulting — based in Seattle, Washington — helps operational and technology leaders:
- Replace manual reporting with a scalable Microsoft Power BI implementation
- Design ETL pipelines and data warehouse architectures that serve reporting needs without disrupting operational systems
- Deliver Microsoft Dynamics Power BI integration that connects source data to dashboards automatically
- Build self-service reporting capability so the organization isn’t dependent on specialists
- Make the transition from data collection to data-driven decision-making
Whether you need an experienced Power BI consultant, a SQL Server data warehouse built from scratch, or a Microsoft Dynamics integration that feeds your reporting automatically — Step 7 has the architecture and implementation experience to deliver it.
The result isn’t just better reports — it’s a reporting infrastructure that scales with the business.
Project Artifacts
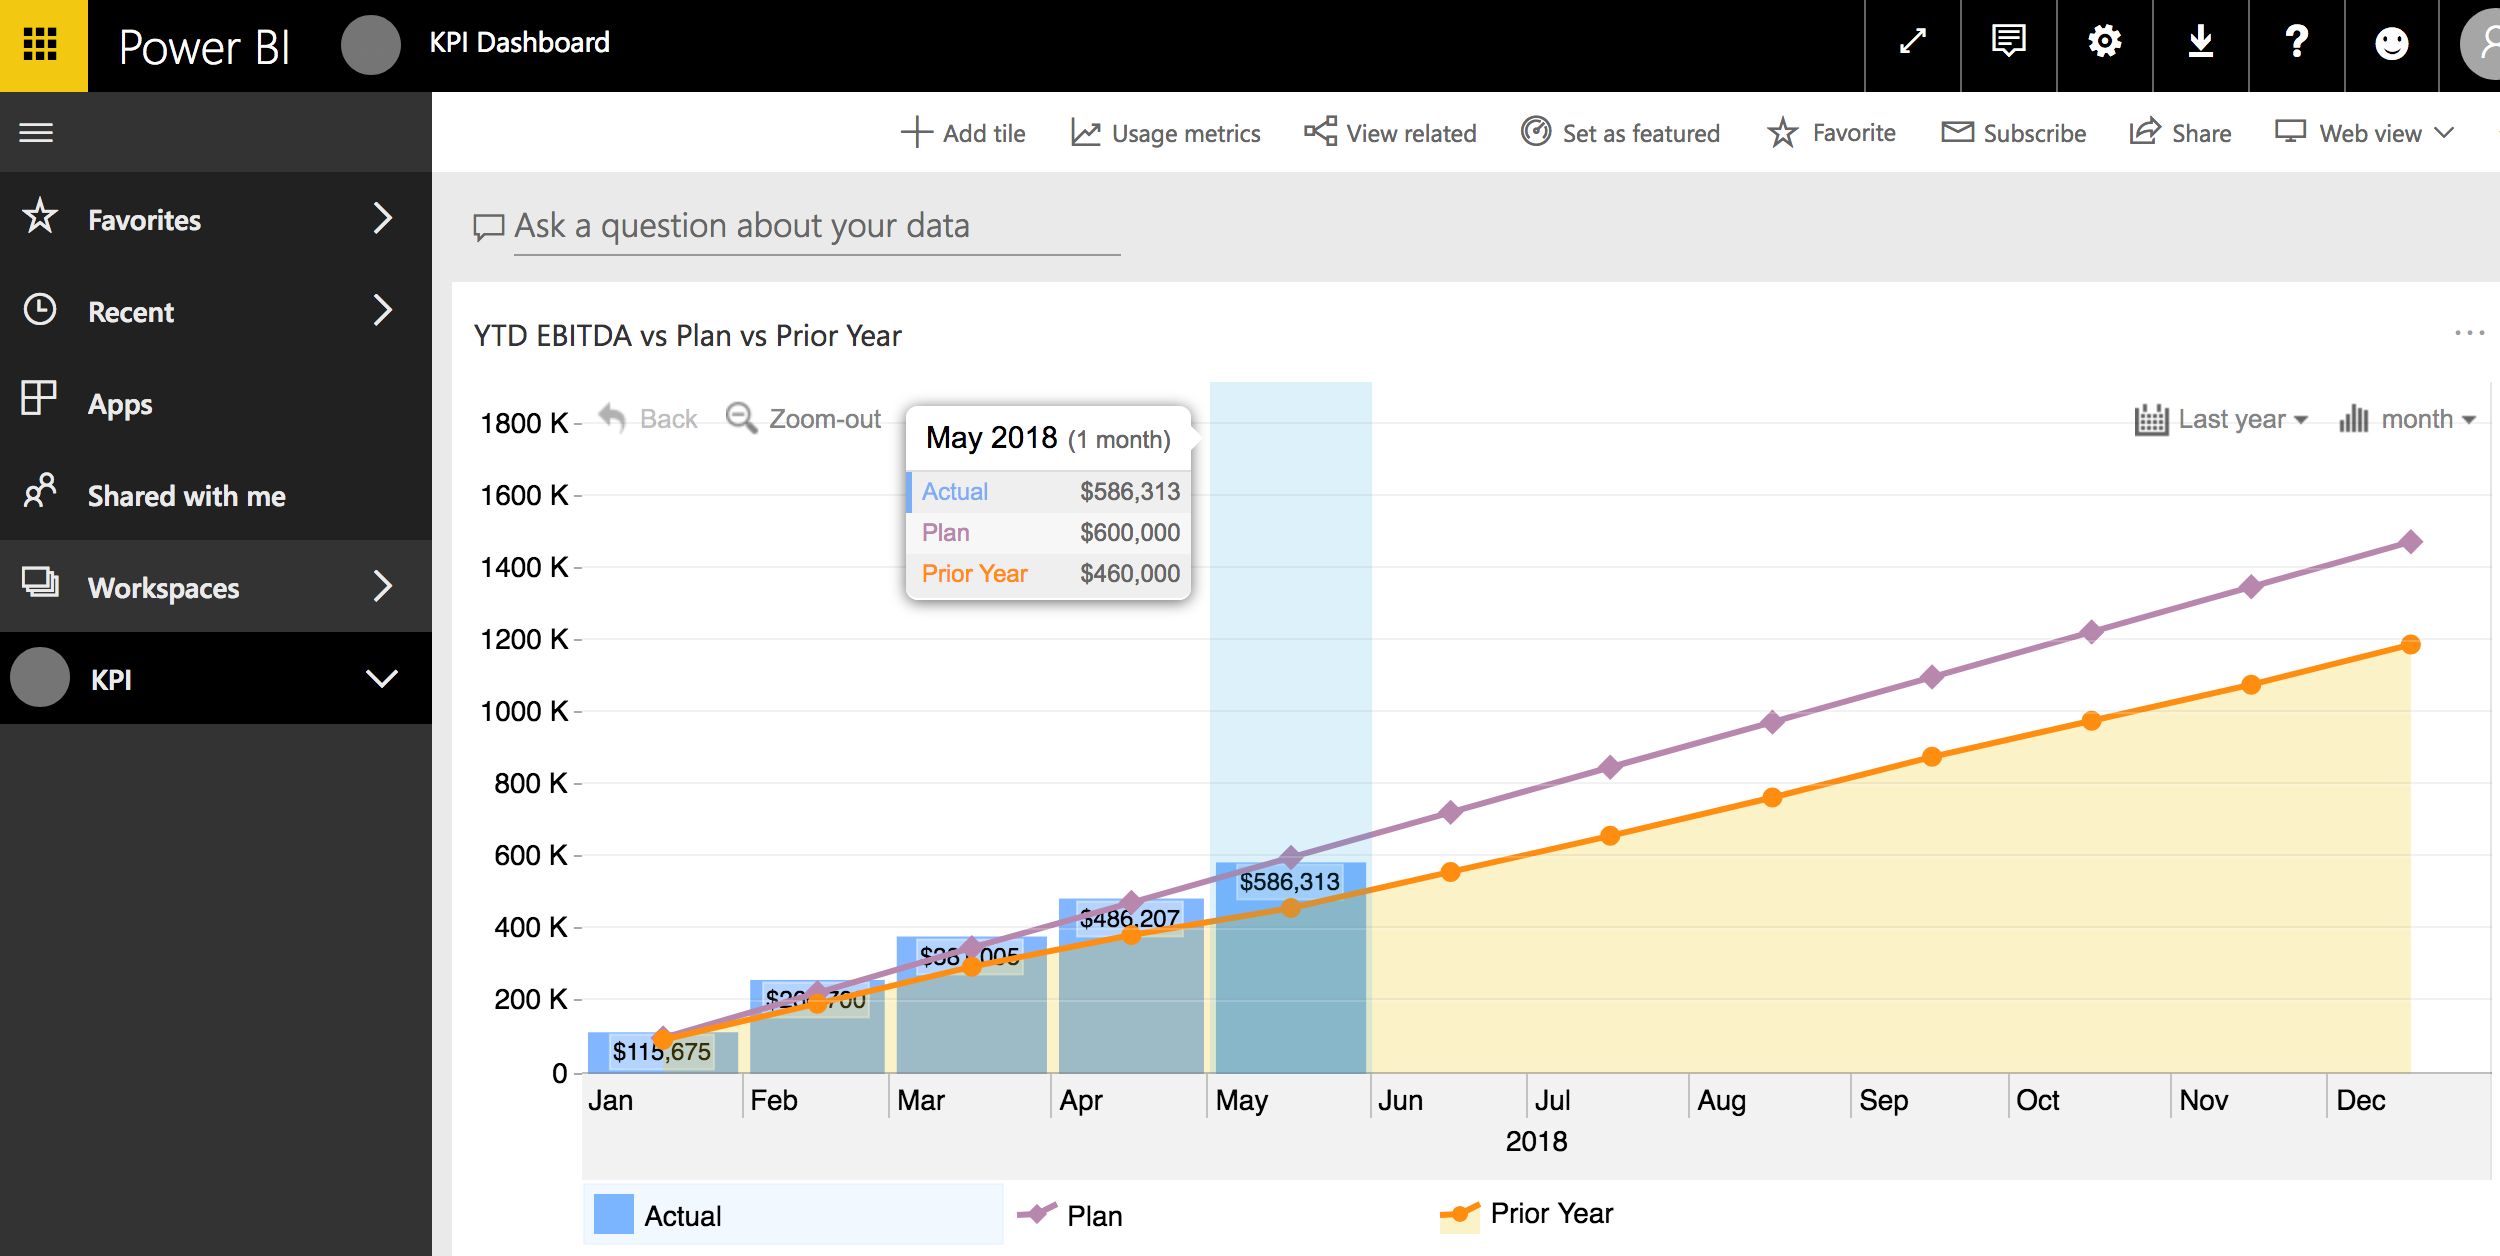
Microsoft Power BI Trend Forecast Report
Product Launch Schedule and Performance KPI Report